
58
2. A “Block and Index” Structure:
Here, a customer can fix all or a
portion of the price. The pricing can
be locked in blocks or percentage
levels at different times. While this
requires more management and
oversight, it allows a company to
dollar-cost-average their price,
similar to what an investor would do
with a stock purchase.
Given the energy factors discussed
above and current market pricing for
electric and natural gas, we could be
faced with rising rates in the future.
As a result, businesses need to look
at the importance of proactively
managing their energy procurement
now in order to reduce the potential
negative exposure that could be
coming down the road.
7X24 MAGAZINE SPRING 2015
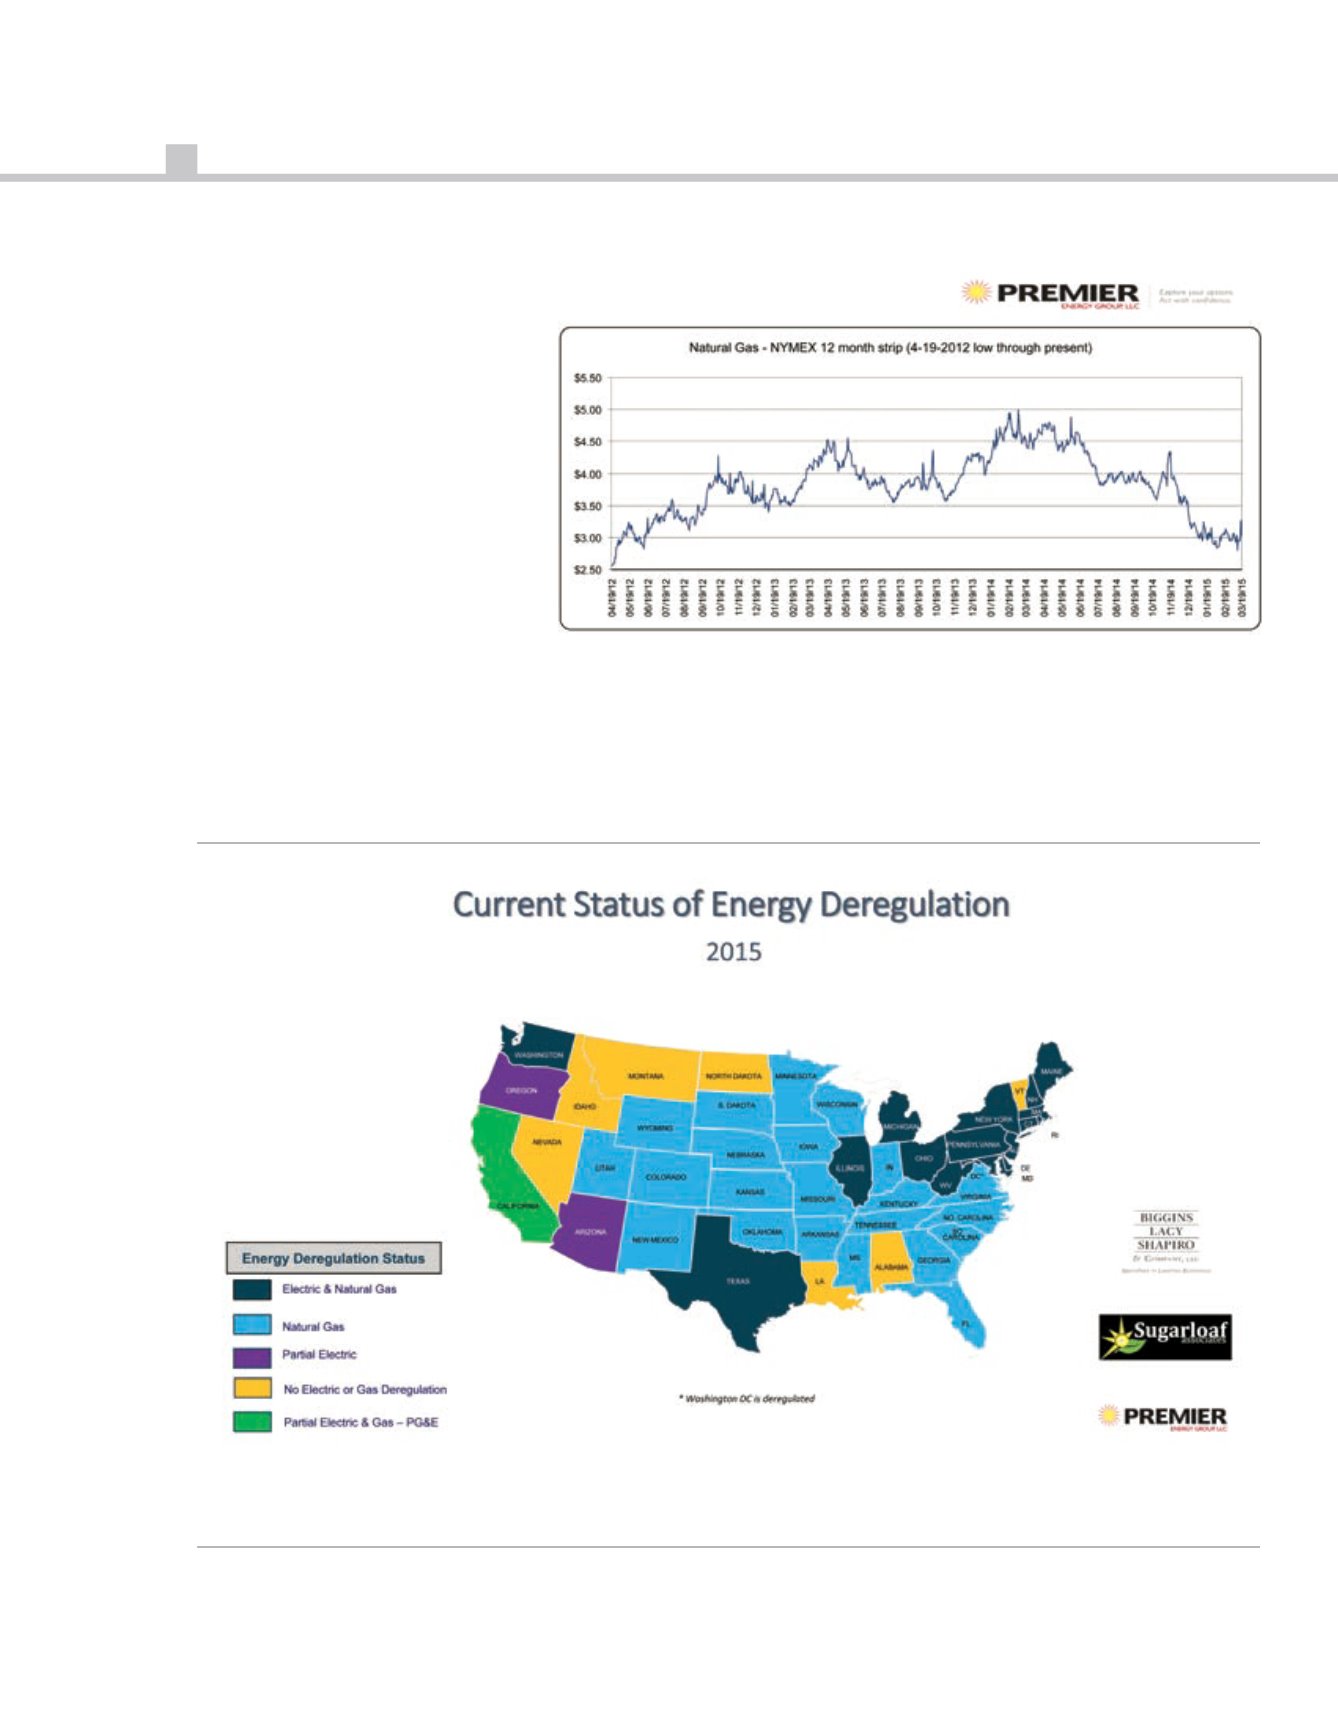
Graphic 2 – Map of Deregulated Markets (PPT slide)
Graphic 1 - Natural Gas Price Trends
This graph shows the 12-month average future price trend for natural gas since April
2012. After reaching a 10-year low in April 2012, natural gas prices moved significantly
higher over the next two years. Prices have since dropped and are now just slightly
above the low reached in 2012.
Tim Comerford is the SVP of Biggins Lacy Shapiro’s Energy Services group and principal of Sugarloaf Associates.
He can be reached at
[email protected]Joe Santo is the Principal and Director of Business Development at Premier Energy Group, LLC. He can be reached at
[email protected]


